Looking for a different project? Check out one of my other works here:

Machine Learning Interpretability
through Contribution-Value Plots

Contribution-Value plots are a new visual encoding for interpreting machine learning models.
It can be used as one of the elementary building blocks for interpretability visualization.

Why?

Modern machine learning models are usually applied in a black-box manner: only the input (data) and
output (predictions) are considered, the inner workings are considered too complex to understand.

How?

To solve the black-box problem, one key approach is to show the impact of a feature on the model prediction.
These techniques are commonly used as elementary building blocks for interpretability visualization.

We experimented with combining contribution and sensitivity analysis techniques:
our contributions are highighted in blue.

Contribution-Value Plots

A basic example of the Wine Quality data set, and a Random Forest with 100 trees as the complex model we would like to analyze.


Insights about alcohol

  • A more important feature than pH (more vertical dispersion).
  • For some instances a positive, and others a negative contribution.

Insights about pH

  • 2 different values are important: 3.05 and 3.35.
  • There are two clusters that each have a different threshold (use selection).
  • The clusters correspond with high and low values of alcohol respectively.

Try it out!

We built a Python library to generate Contribution-Value plots for any scikit-learn model, and is optimized for usage in interactive environments such as Jupyter Notebooks.

To GitHub

Citation

If you want to refer to our visualization, please cite our paper using the following BibTeX entry:

@article{collaris2022comparative,
  title={Comparative Evaluation of Contribution-Value Plots for Machine Learning Understanding},
  author={Collaris, Dennis and van Wijk, Jarke J.},
  journal={Journal of Visualization},
  volume={25},
  number={1},
  pages={47--57},
  year={2022},
  publisher={Springer}
}
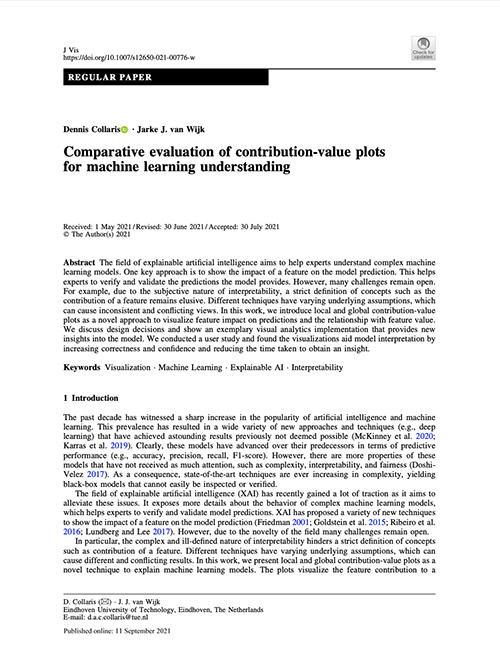
(This paper is an extended version of our prior work "Machine Learning Interpretability through Contribution-Value Plots")